
How to Run a Condominium Meeting with Charts and Results
How to Run a Condominium Meeting with Charts and Results
Dicas para Síndicos e PMES
 02/03/2026
 5 min
5 minThe condominium general meeting is the main instrument for collective decision-making within the condominium community and plays a decisive role in setting financial priorities, reporting on accounts and making strategic decisions. Whether virtual, in person or hybrid, the general meeting is the formal setting where the main issues governing the condominium's interests are debated and voted on, such as approving accounts, raising fees, electing a building manager and adjusting the by-laws.
A good condominium meeting doesn't happen by chance: it depends on organisation, technical preparation and a strong ability to communicate “what has been done” and “what will be done” in an objective way. Putting together a presentation with charts of the key indicators makes all the difference so that residents don't just hear numbers, but understand them and know their impact on the day-to-day running and budget of the development.
This guide sets out a professional roadmap for preparing a general meeting, collecting and organising figures, turning data into relevant charts and highlighting the results clearly. It is useful both for experienced building managers and for managers looking to raise the level of transparency and effectiveness of their meetings.
The role of financial reports in the general meeting

One of the main aims of any general meeting is the reporting of accounts. Financial reports that show income, expenses, cash balance, arrears and use of the reserve fund are essential for bringing transparency to management.
Modern condominium management systems (such as those that allow full reports to be generated and printed or exported to spreadsheets) help building managers organise the data for the meeting.
These reports should include items such as a statement of income and expenses, current cash balance and projected cash flow. Other important figures include total arrears amounts (it is important not to expose any individual unit over arrears) and items for extraordinary spending.
Intuitive charts and detailed reports make it easier to analyse expenses and income, enabling more assertive decision-making by managers and residents in attendance. They also help with visualising and understanding data that can be harder to grasp in a dense meeting such as a general assembly.
A good practice is to consolidate this data into periodic reports (monthly or quarterly) and then present the consolidated results at the meeting, comparing periods, targets and outcomes.
Preparing the figures: how to collect and organise relevant data
Before creating your presentation with charts, you will need to collect data in advance. Preparation involves:
Financial data
Monthly income (including ordinary and extraordinary fees);
Fixed and variable expenses;
Cash balance at the start and end of the period.
Arrears indicators
Having a clear history of arrears makes it possible to show how management has been working to recover overdue payments, as well as showing whether the problem is growing or shrinking over time. Modern management systems make it possible to access the arrears history for set periods, in charts and detailed reports.
Other important metrics
Besides the indicators above, other figures can help with analysing the results:
Reserve fund balance;
Comparison between projected and actual budget;
Trend in maintenance and upkeep spending;
Resource consumption (electricity, water) in common areas.
Organise this data in a spreadsheet (such as Excel or Google Sheets) with the appropriate columns (month, amount, category, notes) to make it easier to create charts and carry out comparative analysis.
Turning figures into charts in Excel

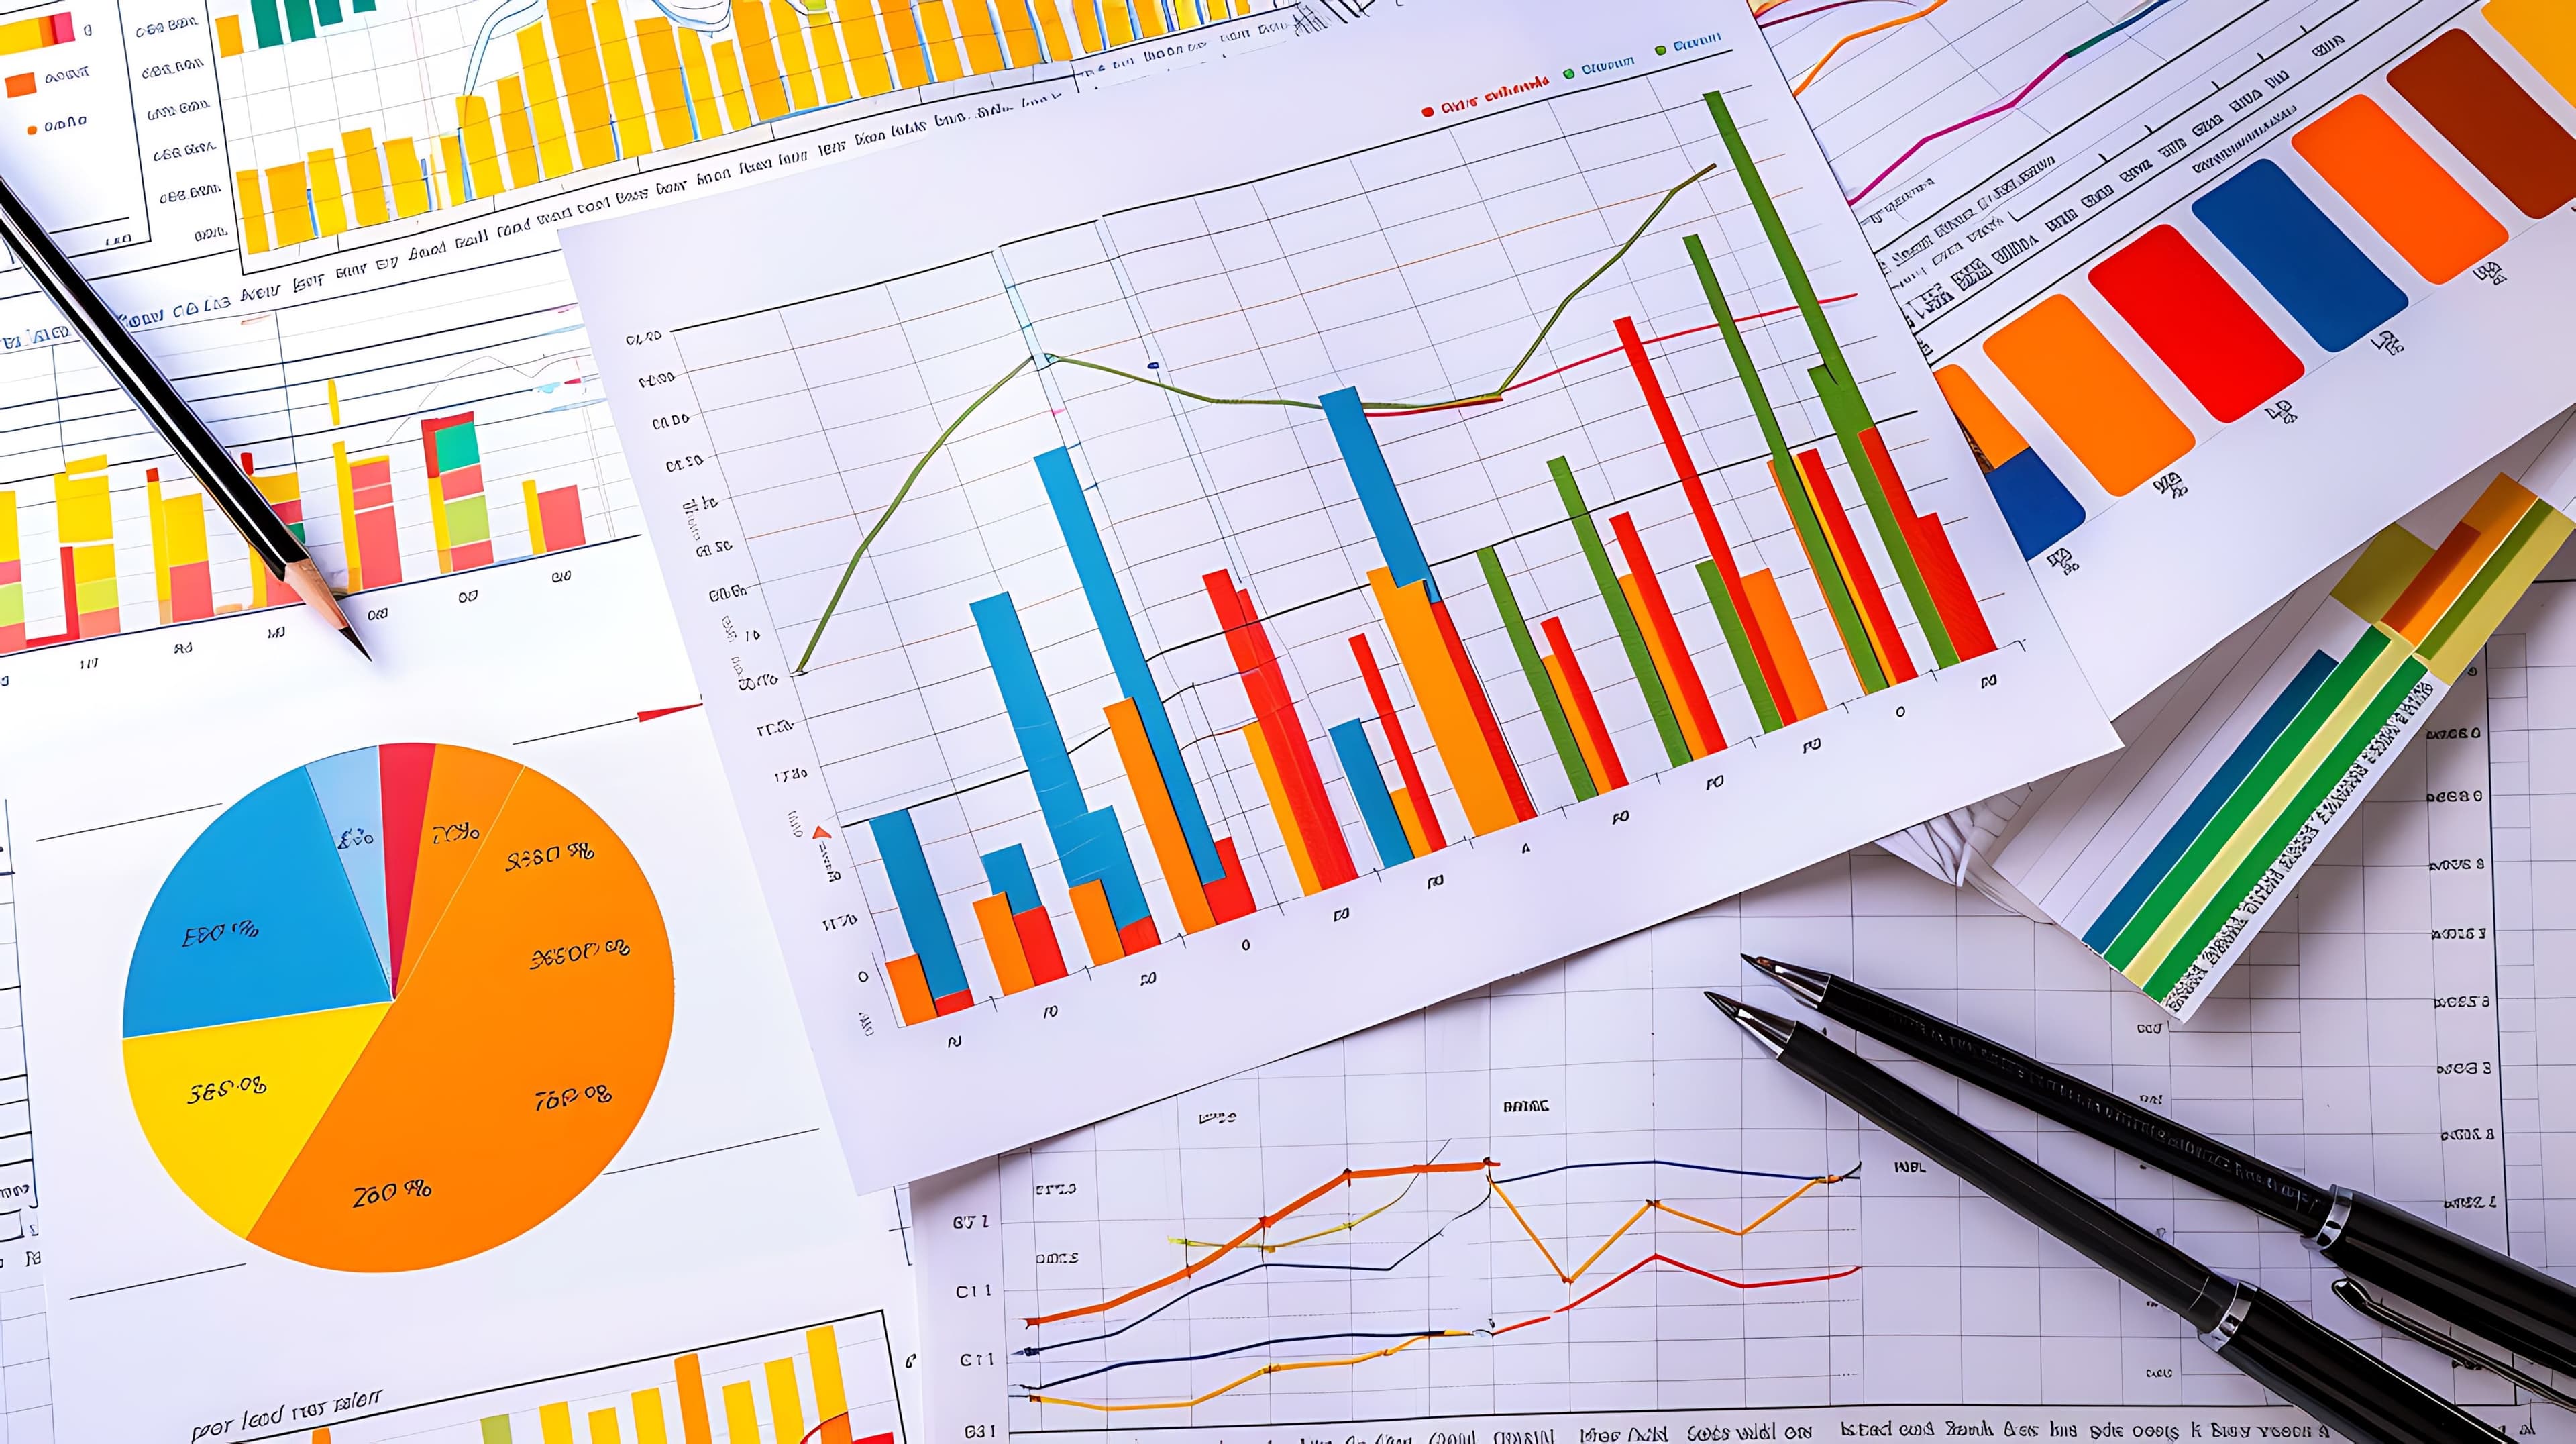
A presentation with charts makes the data far more intuitive for residents. This visualisation helps highlight annual or monthly trends, the relationship between income and expenses, arrears trends and the breakdown of spending.
Here is a practical tutorial for two types of charts widely used in general meetings:
Pie chart (circular chart)
Ideal for showing percentage shares, such as the breakdown of expenses by category or the proportion of units in arrears.
Select the data representing categories and their respective values.
In Excel, go to the Insert.
Choose Pie Chart and select the style you want.
Adjust colours and legends; add data labels (% or values) directly on the chart.
The pie chart helps answer questions such as: “What percentage of expenses relates to maintenance out of the total?” or “Which part of the budget was used by each type of expense?”, making the visual results accessible to everyone.
Bar chart
This is useful for comparing results between periods, such as trends in income and expenses over the months.
Set up a table with months in one column and figures (for example, income and expenses) in others.
Select the whole data table.
On the Insert tab, choose Bar/Column Chart.
Adjust the title, legend and axis ranges.
The bar chart helps show trends, such as “Has income growth been consistent over the last 12 months?” or “Are monthly expenses within the approved budget?”, helping to give a clear presentation of the results.
The added value of a presentation with charts at the condominium general meeting
When you turn numerical reports into visual charts, you make it easier for the community to understand. Residents may not be familiar with complex financial statements, and a presentation with charts acts as a bridge between “what the numbers mean” and “how this affects everyday life in the condominium”.
A clear, well-built presentation helps to:
Build trust between managers and residents;
Reduce superficial questions;
Steer the discussion towards strategic decisions;
Show the results of management more transparently and visually.
Presentation templates for general meetings, such as those that can be downloaded free of charge and adapted, show that structuring each slide well — with a title, chart and a concise explanation — makes a difference when seeking support for proposals or approval of accounts.
Drawing up the agenda for the condominium general meeting

An efficient general meeting follows a clear agenda. Good organisation ensures that priority items are presented before the more complex debates, which makes the best use of meeting time.
A recommended agenda includes:
Opening the meeting and checking the quorum
The general meeting cannot make decisions without an adequate quorum, as required by the condominium's by-laws or applicable law.Reading the agenda and setting the context for the period
Briefly explain the context of the period being analysed and the points that will be presented.Presenting the figures and charts on financial performance
Introduce the key indicators using pie and bar charts prepared in Excel, highlighting income, expenses, balances and projections.Discussing arrears indicators
Show arrears trends and their effects on the collective budget, reinforcing that the general meeting plays a central role in decisions relating to collection policies and the budget.Discussing proposals and voting on agenda items
After presenting the results, open the floor for questions and then for votes (if any). Sticking to the agenda avoids digressions and speeds up the process.Closing with the minutes recorded
Once the general meeting is concluded, the minutes should be recorded clearly, containing all the decisions taken, as well as a summary of the presentation with charts and the results obtained.
Transparency and prior access to documents
According to good condominium management practice, communicating and sending reports in advance reduces the number of last-minute questions and speeds up the discussion stage during the general meeting.
Transparency in making documents available such as balance sheets, cash statements and budget projections not only makes the figures presented easier to understand, but also increases residents' confidence in the management's work.
Involving the community in interpreting the results
A successful condominium general meeting is one in which all participants feel informed and able to vote with confidence. This requires not only showing figures and charts, but also interpreting them during the meeting:
Highlight the important trends;
Explain causes and effects;
Indicate which decisions could improve or maintain positive results;
Prepare answers to frequently asked questions.
Cutting the electricity bill with transparency at the condominium general meeting
If the building manager is looking for concrete ways to cut recurring expenses and improve the financial results presented at the condominium general meeting, it's worth considering structured solutions for saving energy. NewSun offers a model that can cut the electricity bill by up to 30%, as well as shielding the condominium against fluctuations in tariff bands. This is a strategy based on clean energy and cost predictability, allowing for greater budget control throughout the year. Although signing up to a clean energy subscription does not require formal approval at a condominium general meeting, transparent management is always advisable — especially when the aim is to demonstrate consistent, sustainable results to residents.
As well as the direct savings, NewSun provides full support to help the building manager put together a clear, technical presentation, should they choose to bring the topic to residents' attention. Even though a vote is not required, sharing the initiative strengthens management's credibility, demonstrates administrative responsibility and helps build an atmosphere of trust between the building manager and residents.
Find out more about our Solutions for Condominiums!
Using technology to support management
Digital management systems can make it easier to organise, collect and display the data that will form part of the presentation with charts. Online tools make it possible to generate reports, track arrears over time and centralise important documents, cutting down on manual work and increasing the accuracy of the figures presented.
A condominium general meeting that is well planned and delivered with the support of a presentation featuring charts and clearly explained results turns a formal gathering into an effective management session. Detailed preparation of the figures, the visual clarity of the charts (such as pie and bar charts in Excel) and the contextual interpretation of the data strengthen residents' confidence in the management, speed up decision-making and make general meetings more productive, democratic and assertive.
You may also like
- Casos de Sucesso
 20/10/2026
 5m
5m - Dicas para Síndicos e PMES16/10/20265m
- Dicas para Síndicos e PMES13/10/20265m





Stop paying more for your energy bill
Find out in less than 1 minute how much you could save with clean energy every month — no works and no bureaucracy.
Join the energy revolution
Subscribe to our newsletter and receive exclusive content